Setting the right price is one of the most critical yet misunderstood aspects of product strategy. Price too high, and you lose market share; price too low, and you leave money on the table.
To remove the guesswork, businesses need a proven willingness to pay methodology. Enter Van Westendorp, a framework designed to measure exactly what your market is ready to spend based on psychological pricing thresholds rather than arbitrary guesses.
What is the Van Westendorp Pricing Model?
When founders and product managers ask, “what is van westendorp pricing model?”, the simplest answer is that it’s a direct, consumer-centric approach to pricing research created by Dutch economist Peter van Westendorp in 1976.
Unlike cost-plus or competitor-based strategies, the van westendorp method relies purely on perceived value from the buyer’s perspective. When conducting van westendorp pricing, you have to let the consumer’s psychological threshold dictate an acceptable price range, making it a favorite for B2B and SaaS businesses looking to validate new product tiers.
The 4 Core Van Westendorp Questions
The foundation of this framework relies on a highly specific set of inquiries. When designing a van westendorp survey, you don’t ask users directly what they want to pay. Instead, you map their mental boundaries using four core questions:
- Too Cheap: At what price would you consider the product so inexpensive that you would doubt its quality and not buy it?
- Cheap / Good Value: At what price would you consider the product a great bargain?
- Expensive: At what price would you consider the product starting to get expensive, but you would still consider buying it?
- Too Expensive: At what price would you consider the product so expensive that you would not consider buying it under any circumstances?
Conducting a Van Westendorp Analysis Step-by-Step
To turn the obtained answers into an proper strategy, you need to conduct a formal van westendorp analysis.
- Step 1: Survey Deployment: Target the right demographic. Your data must come from qualified, potential buyers, or your results will be heavily skewed.
- Step 2: Data Aggregation: Organize the raw responses using cumulative frequencies (calculating the percentage of respondents who chose each price point and adding them up sequentially).
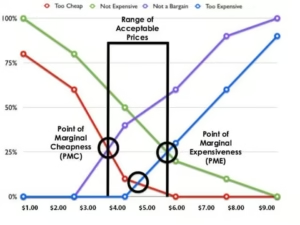
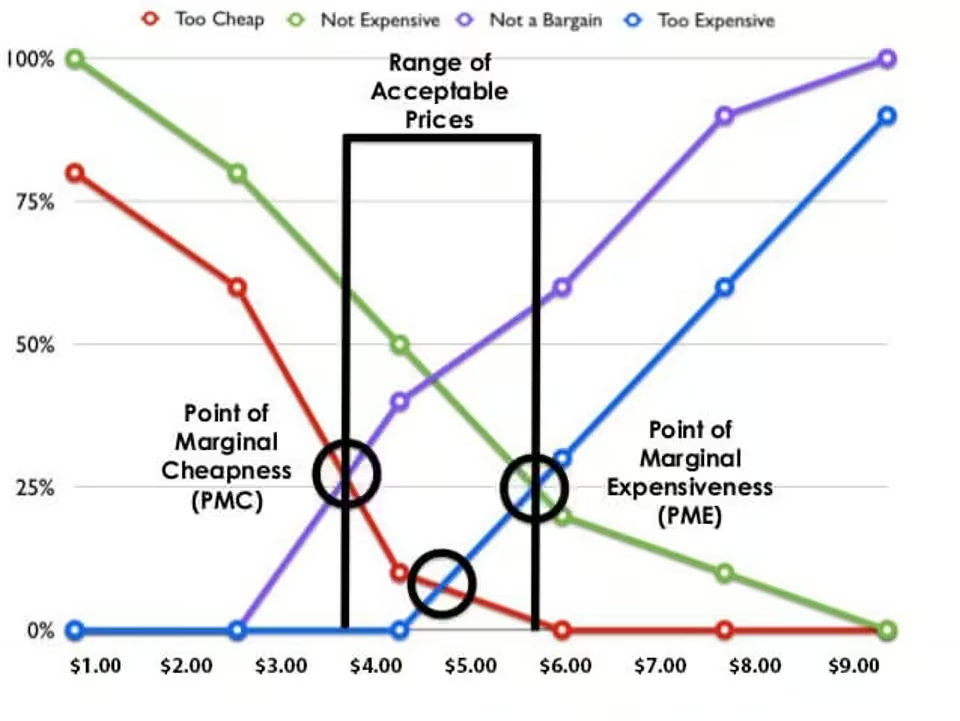
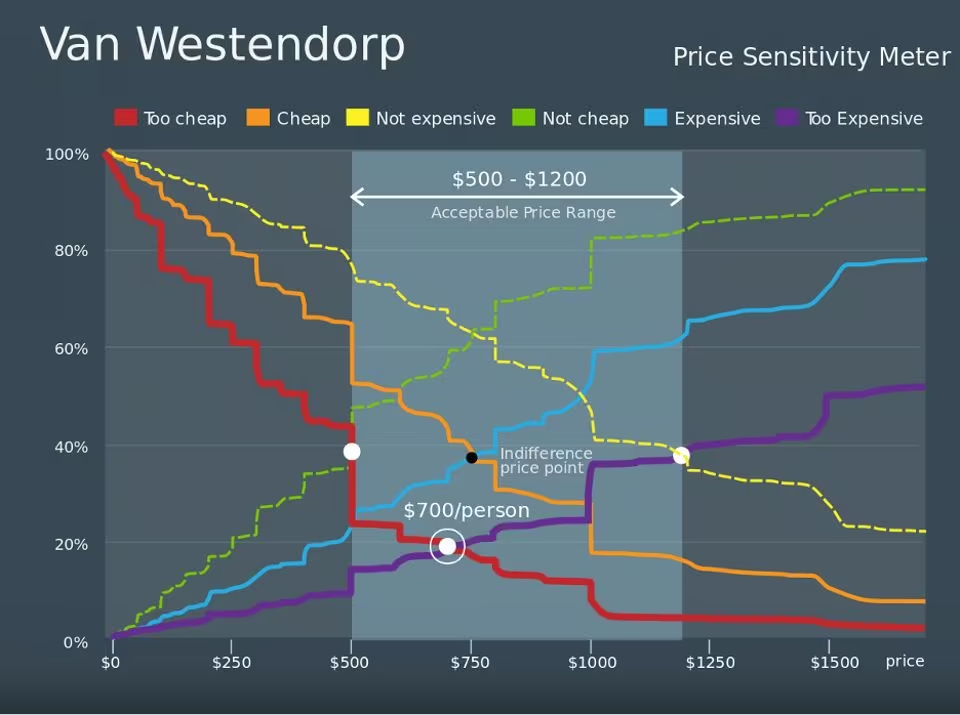
- Step 3: Creating the Visualization: Plot your cumulative frequencies on an X-Y axis to create a van westendorp graph. The X-axis represents the price points, while the Y-axis represents the cumulative percentage of respondents.
- Step 4: Interpreting the Data: This is where the van westendorp price sensitivity analysis comes alive. The intersections of your four plotted lines reveal key pricing thresholds:
- Point of Marginal Cheapness (PMC) & Point of Marginal Expensiveness (PME): The space between these two points defines your acceptable price range.
- Indifference Price Point (IPP): Where the “Cheap” and “Expensive” lines intersect, representing a neutral market feeling where an equal number of people feel the product is cheap as those who feel it is expensive.
- The Van Westendorp Optimal Price Point (OPP): Where the “Too Cheap” and “Too Expensive” lines intersect. This is typically the price point that faces the lowest purchase resistance from your target market.
Advantages of the Van Westendorp PSM
Why do market researchers love this tool? First and foremost, the van westendorp psm (Price Sensitivity Meter) is incredibly fast to deploy and easy for respondents to understand.
Furthermore, it provides a clear, acceptable range of prices rather than forcing you into a single rigid number. Ultimately, the van westendorp pricing model gives product teams the flexibility they need while keeping the focus squarely on the consumer’s genuine perception of value.
Limitations and Alternatives to Van Westendorp
No framework is perfect. The main drawback of this method is that it measures price in a vacuum. It fails to account for specific product features or competitor trade-offs, and because participants aren’t actually spending their own money, it can sometimes reflect aspirational pricing rather than actual purchasing behavior.
If you need to test feature-level changes or you already have a strict baseline, you might want to explore alternatives to van westendorp.
- The Gabor-Granger Method: Excellent if you already have a defined, narrow price range in mind and want to find the revenue-maximizing point within it.
- Conjoint Analysis: The gold standard for measuring trade-offs (e.g., finding out exactly how much extra users will pay if you add a specific premium feature).
Conclusion & Next Steps
A proper pricing strategy shouldn’t rely on gut feelings or boardroom guesses. Using a consumer-centric methodology is an incredibly powerful starting point for discovering a product’s true market value.
For AMC readers, the next step is simple: start incorporating these four foundational questions into your next customer research survey or beta-tester feedback loop. By continuously tracking price sensitivity, you can ensure your product is always positioned for maximum profitability and market adoption.
If you need help interpreting your survey data or want to ensure your framework translates into a winning strategy, reach out to our team for guidance on designing your next willingness-to-pay study.