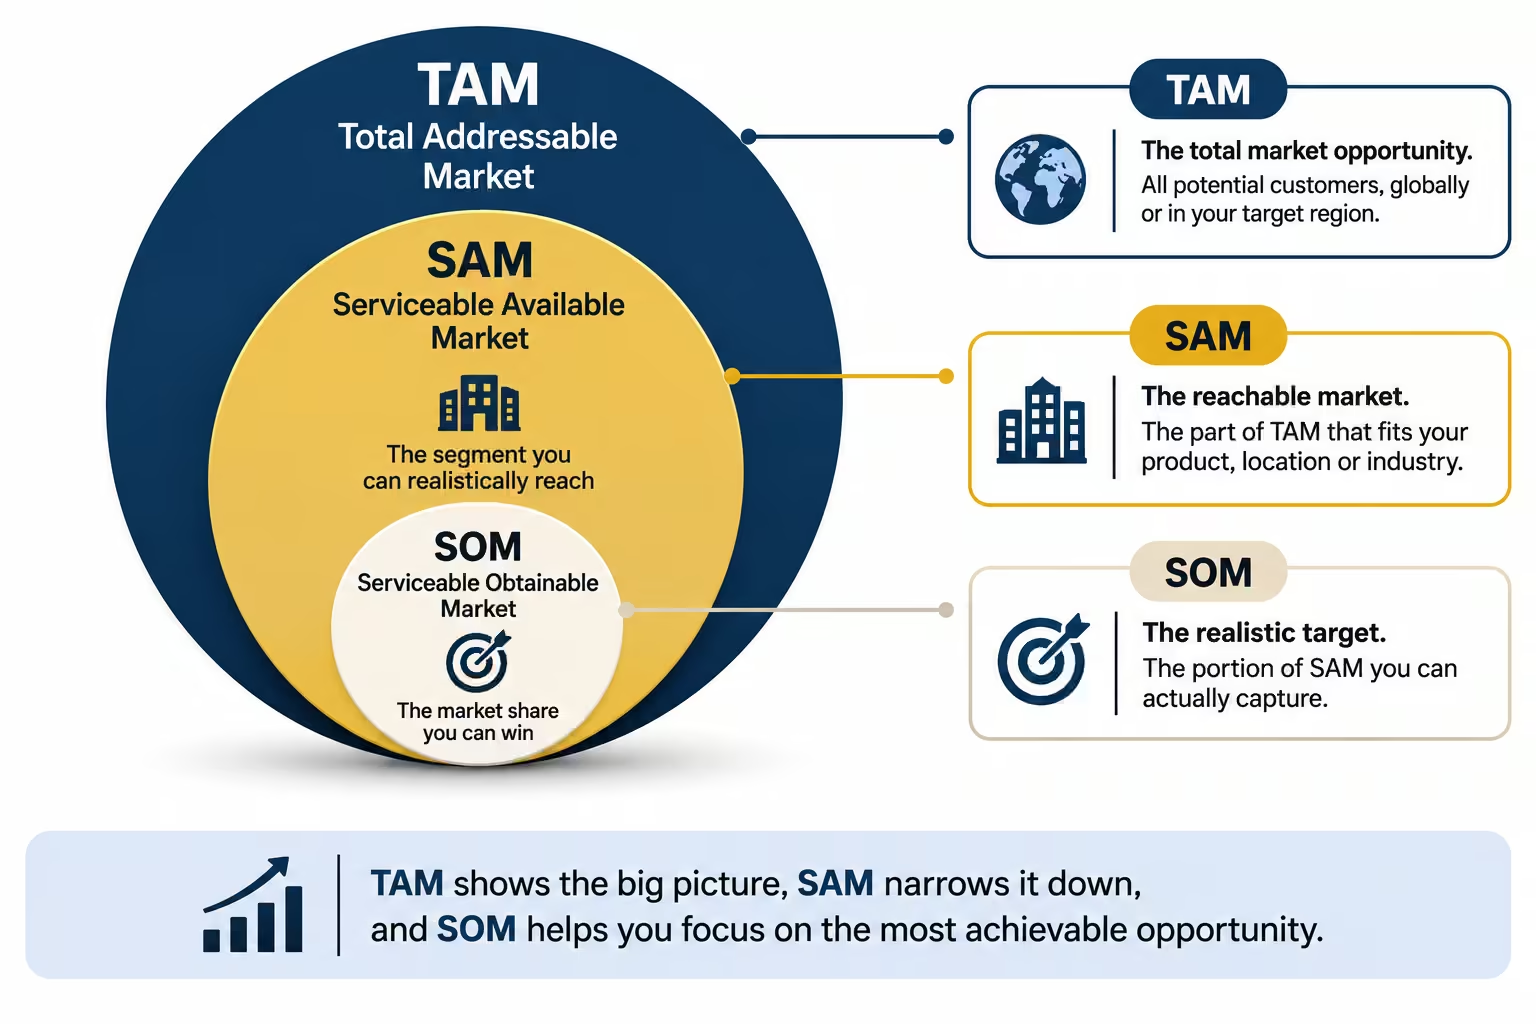
Market sizing analysis estimates the revenue opportunity available in a market so organisations can judge whether an opportunity is large enough, which parts are reachable, and what share is realistic in the near term. It is most useful when a business is deciding whether to enter a category, prioritise segments, allocate investment or prepare growth plans.
What market sizing analysis means in practice
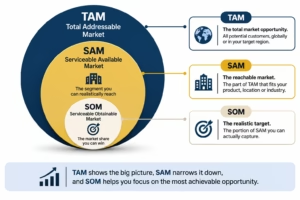
Market sizing analysis produces three nested figures: total addressable market (TAM), serviceable available market (SAM) and serviceable obtainable market (SOM). TAM is the total demand if every potential buyer purchased the product or service. SAM is the portion of TAM that the organisation can serve with its current product, pricing, geography and channels. SOM is the portion of SAM that can realistically be captured within a defined period, given competition, capacity and resources.
Each figure is smaller than the one before it. A SAM larger than TAM, or a SOM that is not linked to actual sales capacity, indicates the model needs revision. The framework answers different questions: how large is the category, which part fits the offer, and what can be won soon.
How to calculate TAM, SAM and SOM
Two common approaches exist. Top-down starts with a published industry or government figure and applies filters. Bottom-up counts potential customers and multiplies by a realistic average annual value per customer. Bottom-up is usually more credible for decision-making because every assumption can be checked; top-down is useful as a cross-check.
A practical sequence is:
- Define the product, customer type, geography and problem solved.
- Count or estimate the total potential buyers for TAM.
- Apply product, channel and geographic filters to reach SAM.
- Apply realistic capacity, win-rate and competitive constraints to reach SOM.
- Document sources, dates and assumptions for every number.
Worked example using UK business population data (illustrative only)
The following numbers are hypothetical and for illustration. At the start of 2025 the UK had an estimated 5.7 million private-sector businesses, of which 38,435 were medium-sized (50–249 employees), according to the Department for Business and Trade’s Business Population Estimates.
Imagine a B2B software supplier whose product is relevant only to medium-sized businesses and is priced at £15,000 per year.
- TAM (all UK medium-sized businesses): 38,435 × £15,000 ≈ £576.5 million.
- SAM (assume 40 % can be reached with current product features, integrations and sales coverage): roughly 15,374 businesses × £15,000 ≈ £230.6 million.
- SOM (assume the sales team can realistically win 250 customers in three years): 250 × £15,000 = £3.75 million.
These figures show a large category, a smaller reachable segment and a much smaller near-term obtainable share. Changing the price, the filters or the capacity assumption changes the result. The example does not represent any real AMC Insights project or client outcome.
When market sizing analysis helps and its limitations
Market sizing analysis supports decisions about market entry, product prioritisation, resource allocation and investor discussions. It is less useful for tactical campaign optimisation or day-to-day customer experience improvement, where other research methods are more appropriate.
Limitations are important. Figures depend on the quality of buyer counts and average-value assumptions. Official statistics such as the Business Population Estimates provide a solid starting point for UK business counts but do not measure demand for a specific product. Secondary reports may use different definitions or geographies. Top-down numbers can overstate opportunity if filters are weak. SOM must be grounded in actual sales capacity rather than an arbitrary percentage of TAM. Results should be treated as estimates with stated confidence ranges and reviewed when market conditions change.
Common mistakes include using an outdated source, mixing buyer types so that average value becomes meaningless, or presenting SOM as a fixed percentage without capacity evidence.
How findings inform business decisions
A clear market sizing analysis helps teams decide whether to invest in a category, which segments to target first, and what revenue range is realistic for planning. It also highlights where further primary research is needed—for example, to validate willingness to pay or competitive intensity. Organisations that combine official statistics, secondary industry data and primary research usually produce more defensible figures than those relying on a single source.
B2B market research and industry sizing services can support this work by combining secondary data with primary research where needed. Market research services more broadly help define the right buyer population and test assumptions. Teams can contact AMC Insights to discuss whether market sizing analysis fits a specific decision. Further context on the organisation is available on the About AMC Insights page.
Conclusion
Market sizing analysis using TAM, SAM and SOM gives a structured way to move from a large theoretical opportunity to a reachable segment and a realistic near-term target. The value lies in transparent assumptions, appropriate methods and clear recognition of limits rather than in any single headline number. Used carefully, it improves the quality of growth and investment decisions.
Frequently asked questions
What is the difference between TAM, SAM and SOM?
TAM is the total demand if every potential buyer purchased. SAM is the part the organisation can serve with its current offer and reach. SOM is the part of SAM that can realistically be captured in a defined period given competition and capacity.
Should I use top-down or bottom-up market sizing?
Bottom-up is generally preferred for decision-making because buyer counts and average values can be checked. Top-down is useful as a cross-check against published industry or official figures.
Where can UK businesses find reliable starting data?
The Department for Business and Trade’s Business Population Estimates and Office for National Statistics business statistics provide official counts of UK businesses by size and sector. These are starting points only; product-specific demand still requires additional research.
How often should market sizing be updated?
Update when significant changes occur in the buyer population, pricing, competitive landscape or organisational capacity, or at least annually for planning cycles.