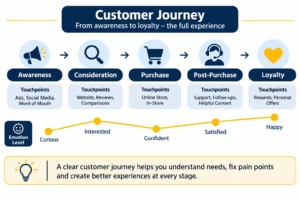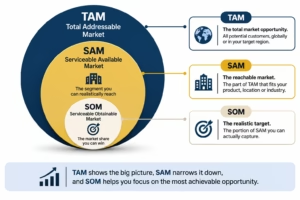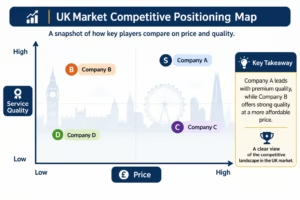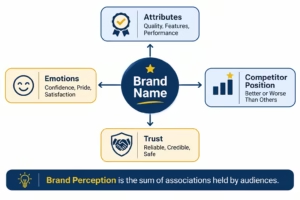
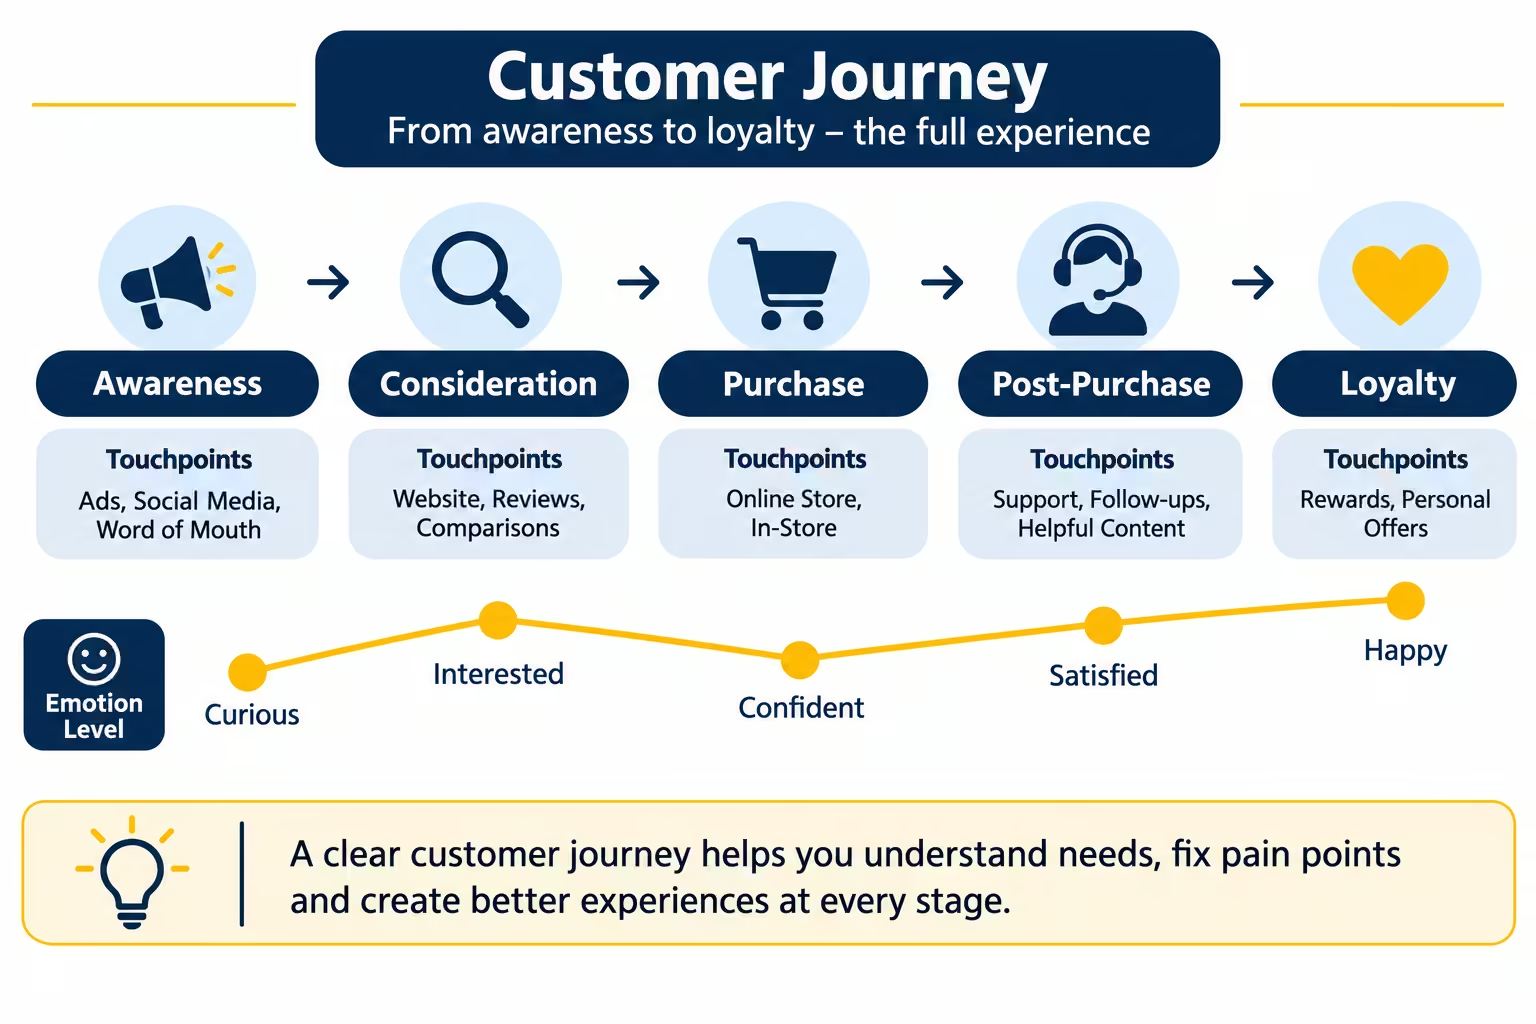
Customer journey analysis examines the end-to-end path customers take when interacting with a brand, product or service. It combines research evidence on stages, touchpoints, emotions and pain points so teams can prioritise improvements that affect satisfaction, retention and commercial outcomes.
For UK businesses, this analysis supports decisions on service design, marketing investment and experience optimisation. It works best when grounded in real customer evidence rather than internal assumptions alone.
What Customer Journey Analysis Involves
Customer journey analysis maps what customers do, think and feel across stages from initial need through post-purchase use or advocacy. UK government guidance on experience mapping describes it as a visual representation of events, interdependencies and pain points over time.
Typical stages include awareness, consideration, purchase, onboarding, use and loyalty or exit. Touchpoints cover channels such as website, app, store, contact centre or social. The analysis also records emotional highs and lows, needs at each stage and where friction occurs.
It differs from a simple process flow because it centres the customer’s perspective and evidence, not internal department hand-offs.
How to Conduct Customer Journey Analysis Step by Step
Start by defining the specific journey and segment. One journey and one measurable outcome (for example, new-customer onboarding or support resolution) keeps the work focused and actionable.
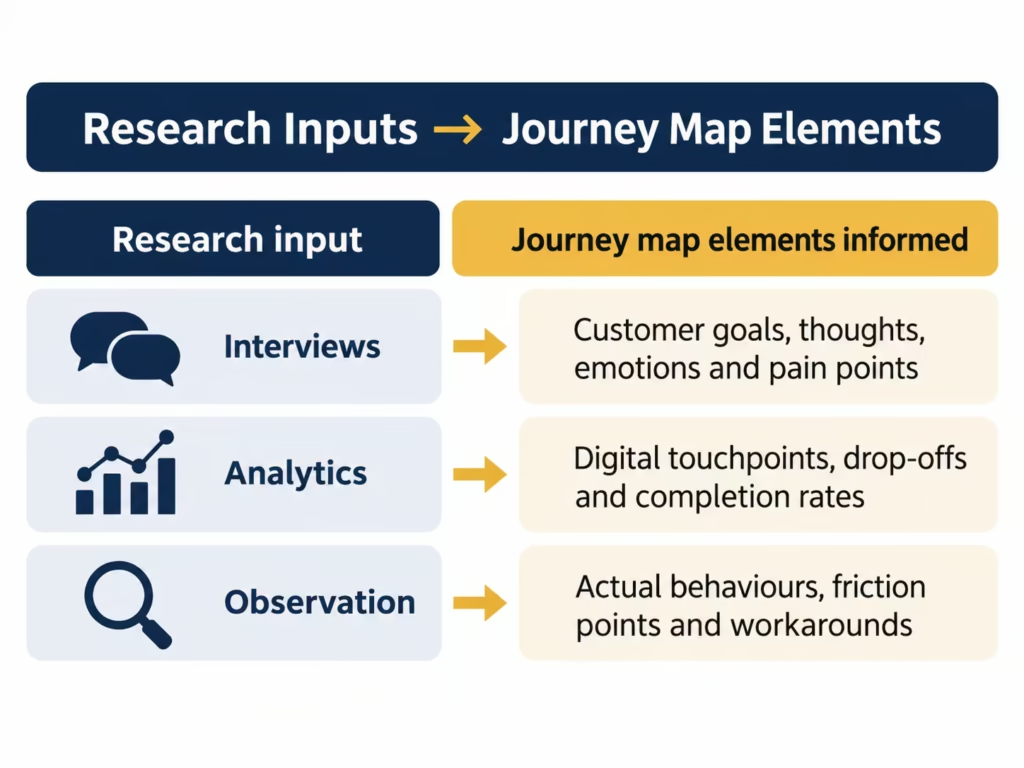
Gather evidence before drawing the map. Useful inputs include:
- Customer interviews or diary studies for motivations, emotions and language.
- Observation or field studies for actual behaviour and workarounds.
- Analytics, CRM or contact-centre data for volume, drop-off and channel use.
- Existing surveys or satisfaction metrics for prevalence of issues.
UK research practice emphasises recruiting participants who have completed the relevant experience and capturing what they did, thought and felt. Event cards or structured notes help consolidate findings across several users.
Next, identify common stages and align individual journeys. Build the spine with steps, then layer touchpoints, emotions, quotes and pain points. Review the draft with the team and frontline staff, then produce a shareable summary version.
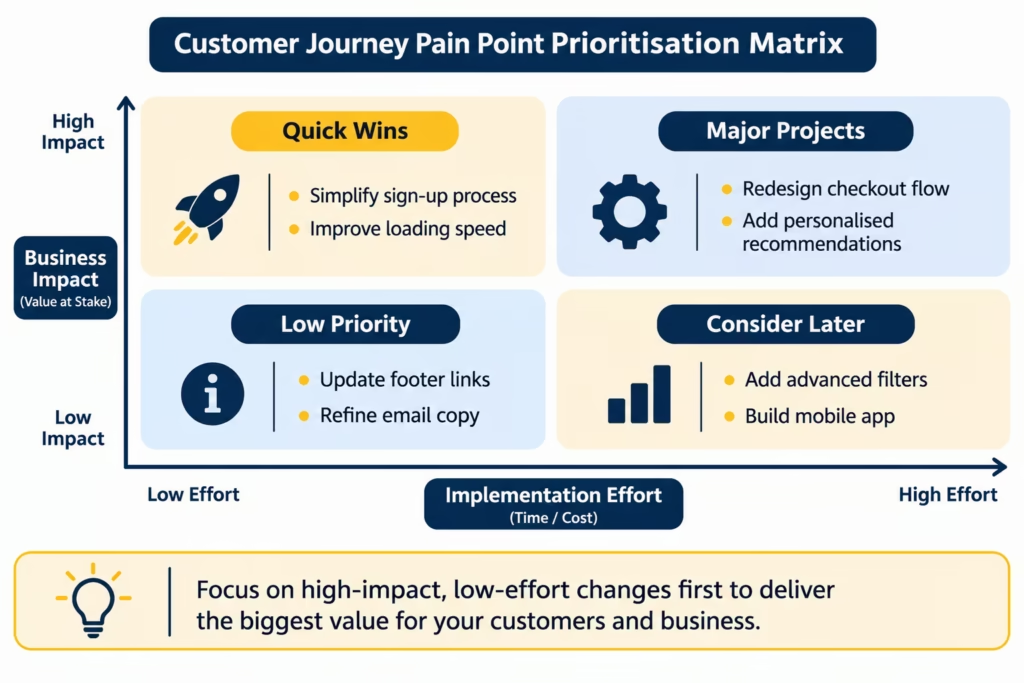
Finally, prioritise actions by impact on the business outcome, effort required and risk. Link findings to Customer Experience Services for optimisation support where needed.
Research Inputs That Strengthen the Map
Qualitative methods reveal why friction occurs; quantitative data shows how widespread it is. Combining both reduces the risk of maps that only confirm internal views. Market Research Society guidance stresses ethical, transparent data collection and participant privacy under UK GDPR.
Limitations include sample size (small qualitative sets cannot be generalised), self-reported bias and the fact that journeys are often non-linear in digital contexts. Treat the first map as a hypothesis and refresh it with new evidence.
How Findings Inform Decisions
A completed analysis highlights moments of truth where experience either builds or erodes value. Teams can then target changes to messaging, process design, channel support or product features.
For example, high effort at a key onboarding touchpoint may justify investment in clearer guidance or self-service tools. Linking the map to customer experience benchmarking helps track whether improvements move the metrics that matter.
Results should be presented with method notes, sample characteristics and limitations so decision-makers understand the strength of the evidence. Market & Consumer Understanding work can supply the deeper behavioural inputs when broader category or brand context is required.
Common Mistakes and Limitations
Relying only on internal workshops produces maps that miss real customer language and behaviour. Ignoring data protection requirements when collecting personal data creates compliance risk under UK GDPR. Over-generalising from a small number of interviews, or treating a one-time map as permanent, reduces usefulness.
Journeys vary by segment, channel and life stage. Separate maps may be needed for distinct groups. No single method captures everything; triangulation across sources improves reliability.
Next Steps for UK Businesses
Define one high-impact journey, gather mixed evidence, build and socialise the map, then prioritise a short list of changes. Measure results and update the map periodically.
For organisations that want structured research support, contact AMC Insights to discuss Customer Experience Services. Offices are in London and Riyadh; capability is confirmed only where published on the site.
Frequently Asked Questions
What is the difference between a customer journey map and a process map?
A journey map centres the customer’s experience, emotions and evidence across stages. A process map shows internal steps and hand-offs.
How many customers should I research for a journey map?
Qualitative depth often comes from 5–8 interviews or observations per segment, supplemented by quantitative data. Exact numbers depend on the decision and variability.
Can customer journey analysis work for B2B as well as B2C?
Yes. B2B journeys typically involve multiple stakeholders and longer cycles; the same evidence-led stages and touchpoints approach applies.
What data protection rules apply in the UK?
Personal data collected for research must follow UK GDPR principles of lawfulness, minimisation and transparency. Seek qualified legal review for specific projects.