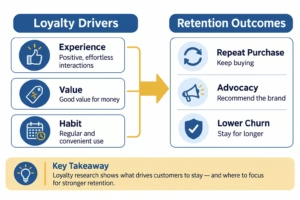
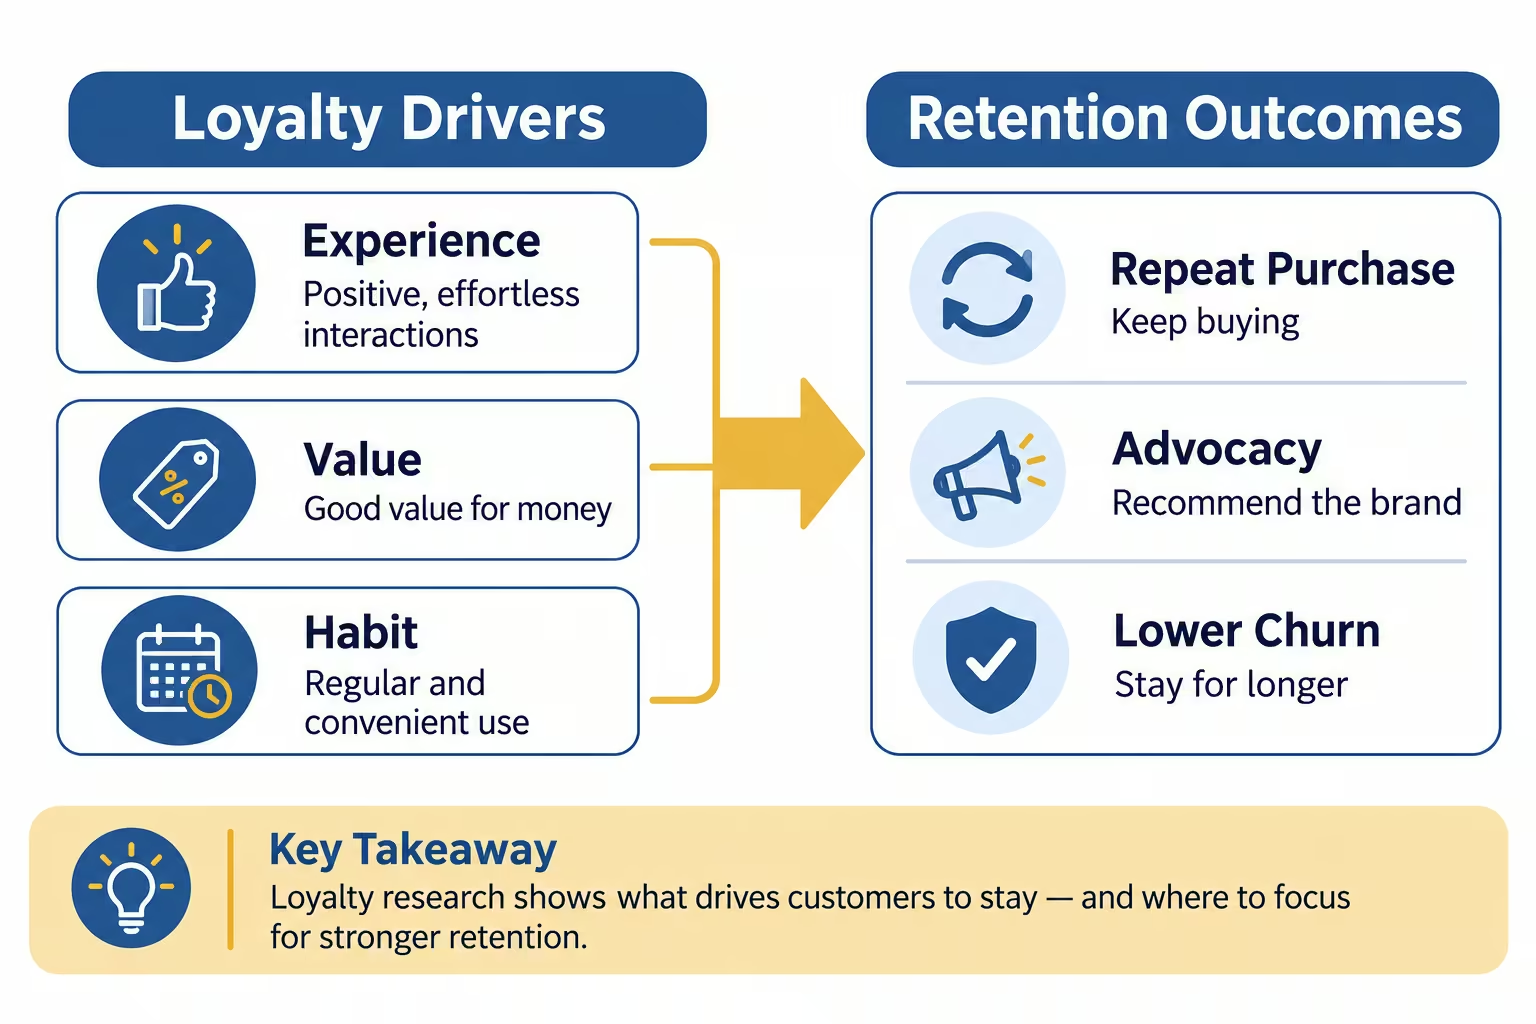
Customer loyalty and retention research measures why customers continue to buy, recommend or stay with an organisation and what causes them to leave. It combines stated attitudes, behavioural evidence and journey insight so UK teams can prioritise actions that protect revenue and reduce unnecessary churn.
UK Customer Satisfaction Index data from the Institute of Customer Service show satisfaction has improved recently, yet gaps remain between high scores and actual retention. Research that links scores to real behaviour helps close that gap.
What customer loyalty and retention research covers
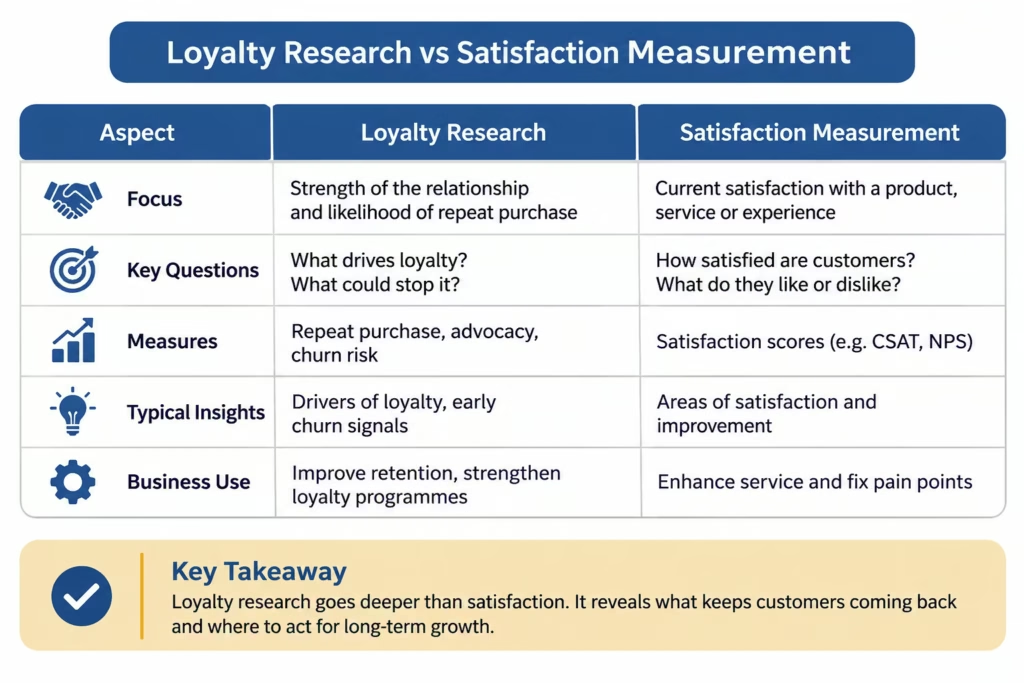
Loyalty research examines the strength of the relationship and the likelihood of continued patronage or advocacy. Retention research focuses more narrowly on the factors that keep customers from switching or reducing spend.
Typical questions include:
- Which experiences or attributes drive repeat purchase?
- Where do customers feel high effort or unmet needs?
- How do loyalty programme rewards influence behaviour versus broader brand perceptions?
- What early signals predict churn in different segments?
Findings are most useful when tied to a clear decision, such as redesigning a programme, fixing a journey stage or adjusting messaging.
Common methods used in UK studies
Most programmes combine quantitative and qualitative evidence.
Quantitative approaches include relationship surveys that track NPS, CSAT or custom loyalty indices, plus transactional feedback after key interactions. Behavioural data from CRM, loyalty schemes or purchase history show what customers actually do. These sources need careful cleaning and matching to survey responses.
Qualitative methods such as in-depth interviews or small discussion groups reveal the language customers use, the emotional triggers and the workarounds they adopt. They are especially helpful when scores fall but the reasons are unclear.
Voice of customer research often supplies the open comments and support data that explain loyalty shifts.
How findings support practical decisions
Clear evidence helps teams choose where to invest.
A Birmingham-based retailer, for example, might use a survey of recent shoppers plus loyalty-card data to test whether a proposed reward change increases visit frequency or merely shifts existing spend. Hypothetical example only.
Typical outputs include:
- Segmented views of loyal, at-risk and lapsed customers
- Ranked drivers of retention (for instance reliability versus price versus ease)
- Gap analysis between stated importance and current performance
- Early-warning indicators for monitoring
These outputs inform programme design, service recovery priorities and resource allocation. They do not guarantee outcomes; results depend on sample quality, question design and how findings are implemented.
Limitations and common mistakes
Stated loyalty often differs from actual behaviour. Surveys can overstate commitment when respondents want to appear positive. Small or unrepresentative samples limit generalisation. Self-reported intent also changes with external factors such as competitor offers or personal finances.
Common mistakes include measuring only programme membership without usage, ignoring data-protection requirements when combining survey and behavioural data, and treating correlation between a score and retention as proof of causation. UK GDPR and the Data Protection Act 2018 apply to personal data; organisations should seek qualified legal advice on lawful basis and consent.
The Market Research Society Code of Conduct sets professional standards for participant protection and reporting transparency. Suppliers that follow it help reduce risk of biased or non-comparable results.
When UK teams typically commission this research
Useful moments include before launching or redesigning a loyalty programme, when churn rises in a segment, or when satisfaction scores stay high yet revenue per customer falls. It also supports benchmarking against sector patterns reported by the Institute of Customer Service.
Customer satisfaction measurement provides the baseline scores that loyalty research then explains.
Practical next steps
Define the commercial decision and the customer definition first. Review existing internal data for signals. Choose methods that match the decision and the available budget and timeline. Pre-test instruments. Report confidence levels and remaining uncertainties so decision-makers understand the limits of the evidence.
Customer Experience Services at AMC Insights can support design, fieldwork and analysis for UK loyalty and retention studies when an independent view is needed.
Frequently Asked Questions
How does loyalty research differ from a standard satisfaction survey?
A satisfaction survey typically scores a specific interaction or overall relationship. Loyalty and retention research goes further by examining drivers, behavioural patterns and the factors that predict continued patronage or churn.
Can loyalty programme data alone answer retention questions?
Programme data show participation and redemption but rarely explain why non-members or lapsed members leave. Combining it with survey or interview evidence gives a fuller picture.
What sample size is needed for UK loyalty research?
It depends on the decision and the segments of interest. Quantitative estimates usually need hundreds of respondents for reasonable precision; qualitative work can use smaller purposive samples. Exact sizes should be set in a scoped brief.
Conclusion
Customer loyalty and retention research gives UK teams evidence on why customers stay or leave. When designed around a clear decision, using transparent methods and acknowledging limits, it supports better choices on programmes, journeys and service. It works best alongside complementary evidence such as satisfaction tracking and journey analysis rather than in isolation.