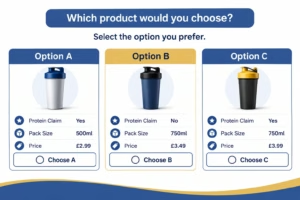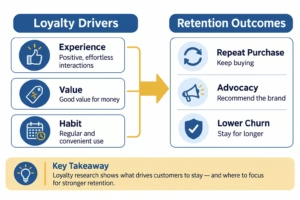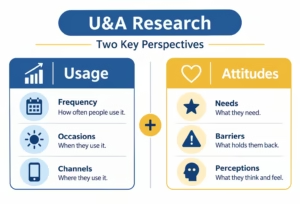
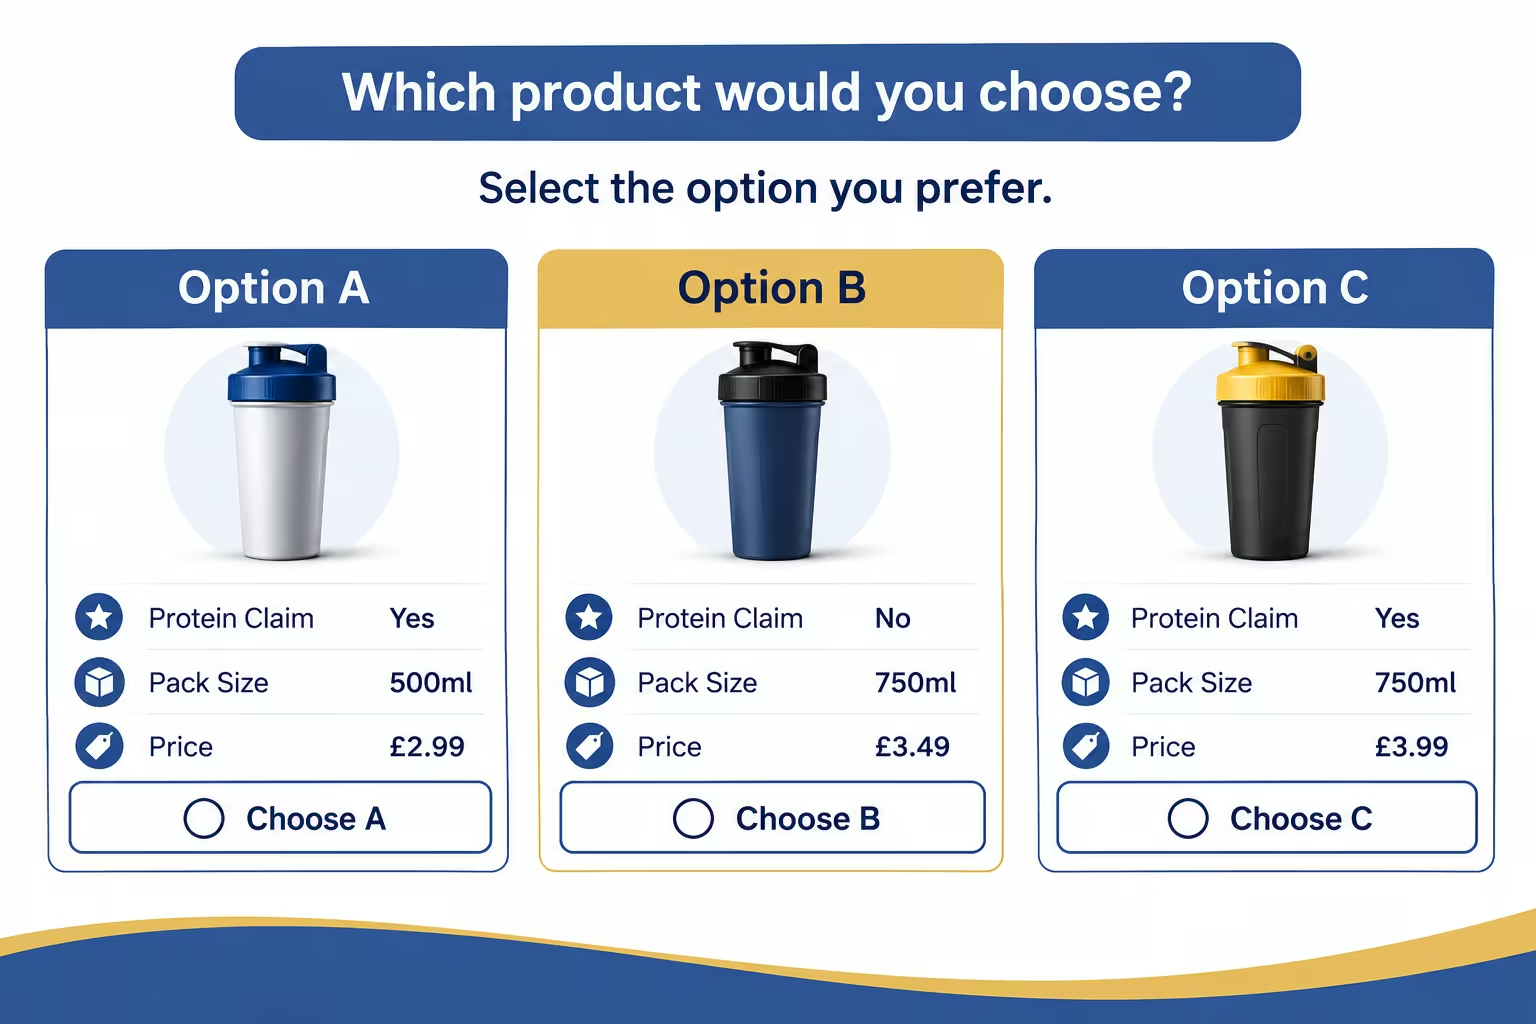
Conjoint analysis is a survey method that presents people with realistic product or service options that differ in features and price, then records which option they choose. It quantifies the trade-offs buyers make and the relative value of each attribute. Teams use the results to design products, set prices and build simulators that test “what if” configurations before launch.
What is conjoint analysis?
Conjoint analysis (also called trade-off analysis or, in some fields, discrete choice experiments) forces respondents to choose between complete alternatives rather than rating attributes one by one. Direct questions such as “how important is battery life?” tend to produce inflated importance scores. Choice tasks better mirror real decisions because every selection involves giving something up.
Typical outputs include part-worth utilities (relative preference for each attribute level), attribute importance scores, willingness-to-pay estimates when price is included, and market simulators that predict preference share for different configurations.
It is most useful for decisions that involve multiple attributes with clear levels—for example, a mobile plan (data allowance, contract length, price), a packaged good (flavour, pack size, health claim, price), or a SaaS tier (feature set, support level, price).
When should teams use conjoint analysis instead of other pricing methods?
Use conjoint analysis when the decision involves combinations of features, packaging or pricing tiers, and you need to understand how attributes trade off against each other and against price. It is less suitable for a single fixed product whose only open question is an acceptable price range.
| Method | Best for | What respondents do | Main output | Relative effort |
|---|---|---|---|---|
| Conjoint analysis (usually choice-based) | Feature bundles, tiers, price–feature trade-offs, simulators | Choose preferred full product from sets of options | Utilities, importance, WTP, preference-share simulations | Higher |
| MaxDiff | Prioritising a long list of individual features, claims or messages | Pick best and worst from small sets of items | Ranked preference scores | Medium |
| Van Westendorp | Acceptable price range for one defined offer | Answer four price-threshold questions | Acceptable range and optimal price point | Lower |
| Gabor-Granger | Demand curve and revenue-maximising price for one product | Indicate purchase intent at sequential prices | Price elasticity and revenue curve | Lower |
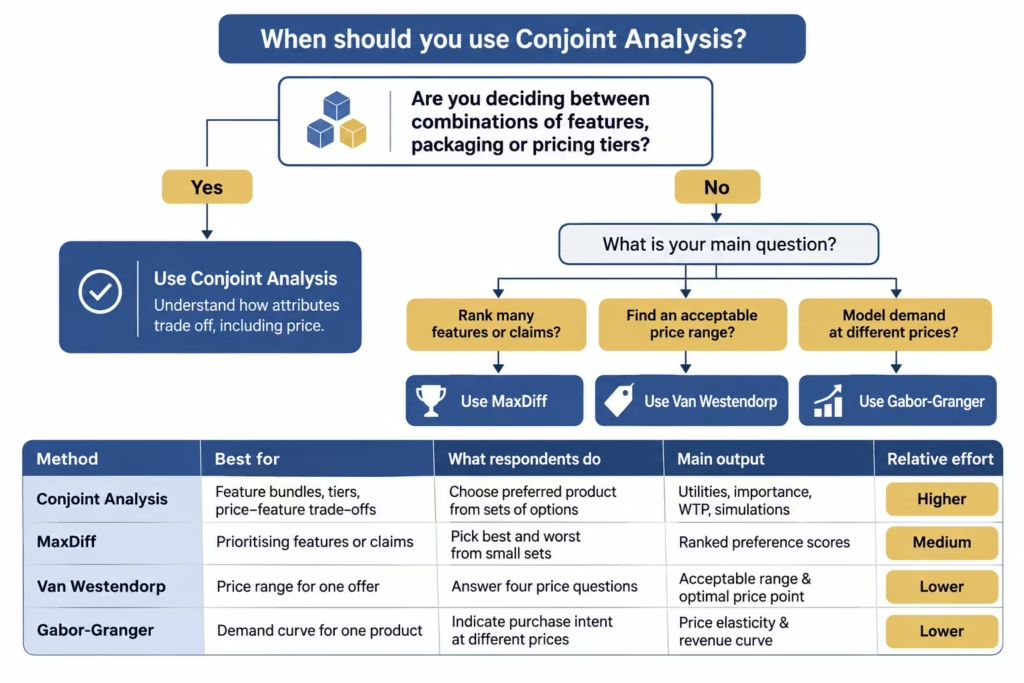
Simpler methods answer narrower questions faster and with smaller samples. Conjoint analysis is warranted when the cost of a wrong feature or packaging decision is high and you need to model combinations. See the existing guides on the Van Westendorp pricing model and the Gabor-Granger method for those approaches.
How does a conjoint study work?
A practical sequence for most commercial studies is:
- Define the decision and the attributes that genuinely influence it. Limit to roughly four to eight attributes; more creates fatigue. Levels must be realistic and mutually exclusive.
- Create an experimental design so that attribute levels appear in balanced combinations across choice tasks.
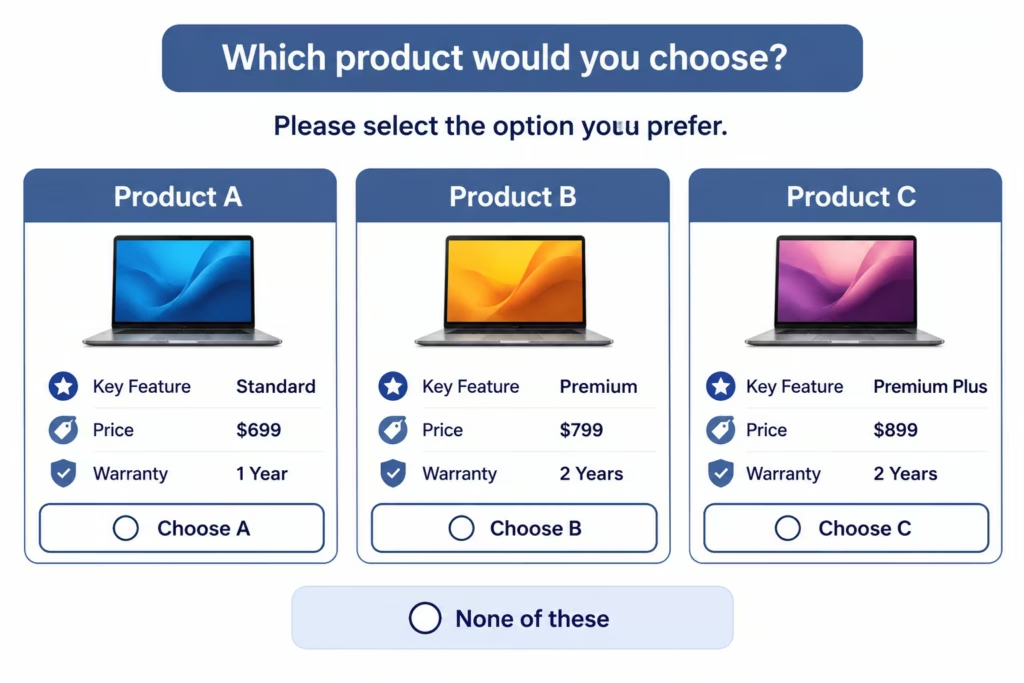
- Field a survey in which respondents complete a series of choice tasks (often 8–16 tasks, each showing 2–4 product profiles plus an optional “none” option).
- Analyse the choices (commonly with hierarchical Bayes or similar models) to estimate utilities.
- Build a simulator to test configurations, price changes or competitive scenarios.
Attribute selection is the most common point of failure. Include only attributes buyers notice and that the organisation can actually vary. Pre-test language with qualitative research so levels are clear and credible. Sample sizes for standard choice-based conjoint studies are frequently in the 200–500 range, with larger samples needed for complex designs or segment-level analysis. Industry heuristics such as those associated with Sawtooth Software relate sample size to the number of levels, tasks and alternatives per task.
Types of conjoint analysis
Choice-based conjoint (CBC) is the most widely used form today. Respondents simply select the preferred option from each set, which feels natural. Earlier rating or ranking approaches still exist but are less common for commercial work. Adaptive methods adjust subsequent questions based on earlier answers and can be efficient with smaller samples, but they add design complexity. Partial-profile approaches show only a subset of attributes in each task when the full set would be overwhelming.
Common mistakes and limits
Common problems include too many attributes or levels, unrealistic price points, failure to include a “none” option when it matches the real market, and over-interpreting simulator outputs as guaranteed market share. Conjoint analysis measures stated preference under controlled conditions; actual behaviour can differ because of stock availability, promotion, habit or social influence. Results are sensitive to the attributes chosen—if a critical driver is omitted, the model is incomplete.
It also requires careful experimental design and statistical expertise. Many organisations therefore partner with a research firm that already runs conjoint and MaxDiff studies rather than building the capability from scratch. Market research services and innovation and product development support can incorporate these methods when the decision warrants them. Related context appears in the guide on how market research supports new product development.
Hypothetical example (not an AMC project): a UK beverage brand testing whether a protein claim justifies a £0.50 price increase. Conjoint analysis can estimate the share impact of that combination against current and competitor options; a simple price-sensitivity question cannot.
Frequently Asked Questions
What is the difference between conjoint analysis and MaxDiff?
Conjoint analysis evaluates complete products made of several attributes (including price) and supports packaging and pricing simulators. MaxDiff ranks a flat list of individual items by relative preference and is better for long feature or message lists. They are complementary: MaxDiff can shortlist items for a later conjoint study.
When is Van Westendorp or Gabor-Granger enough?
Use them when you are pricing one defined offer and do not need to model feature combinations. Van Westendorp gives an acceptable range; Gabor-Granger gives a demand curve for specific prices. Move to conjoint analysis when features, bundles or tiers are part of the decision.
How large a sample is typically needed?
Standard commercial choice-based studies often target 200–500 respondents, with more required for complex designs or segment analysis. Exact needs depend on the number of levels, tasks and alternatives. Always check the experimental design’s efficiency before fielding.
Can conjoint analysis be used for B2B or Saudi markets?
Yes. The method is the same; the sample must represent the actual decision-makers or buyers in the relevant market (UK, KSA or elsewhere). Attribute levels and language should reflect local purchasing realities.
What are the main limits?
Stated choices are not actual purchases. Poor attribute selection or unrealistic levels produce misleading utilities. Simulators are models, not forecasts of future market share.
Conclusion
Conjoint analysis is the appropriate method when product or service decisions involve genuine trade-offs between features, packaging and price. Simpler techniques answer narrower pricing questions more quickly. A short scoping checklist—clear decision, limited realistic attributes, adequate sample, and a plan for how the simulator will be used—reduces the most common failures.
If you are assessing whether conjoint analysis, MaxDiff or a simpler pricing method fits an upcoming product or pricing decision, contact AMC Insights to discuss the research design.